

Free Automated Trading NinjaScript
$0.00
This Free Automated Trading NinjaScript will place simulated trades behind the scenes to feel out the current market conditions. The “Shadow Probe” will enter and track hundreds of simulated positions with a range of stop/target combinations in order to find the most successful stop/target combination at any given time.
Overview
This download contains the .cs code for the Free Automated Trading NinjaScript strategy. We call this strategy "Shadow Probe" and here's what it does: The Shadow Probe will place simulated trades behind the scenes to feel out the current market conditions. When your defined tracking time starts each day, the Shadow Probe will enter and track hundreds, even thousands, of simulated positions with every stop/target combination in a range you define (e.g. if you set the range to 2-100, the Shadow Probe will run simulated trades with a stop/target of 2/2, 2/3, 2/4…… all the way to 100/99, 100/100, and so on, testing every combination therein. You can have the shadow trades for each stop/target combination run consecutively or overlap, giving you a more granular sampling of market conditions. With this data you will know the most successful and profitable stop and target combination at any given moment. Since you have full access to the NinjaScript, you can also add your own filtering criteria to find most profitable stop and target combination under specific conditions (i.e. the stop/target combo that performs the best when the ADX is at a certain level, or when one moving average is above another), the most profitable stop/target combo over the last x minutes, or an infinite number of other ways you can think of to utilize the probe data. It comes out of the box with generic entry criteria (see the “entry logic” region in the code). This region is where you can set the conditions that need to be met to trigger a buy or sell order with the stop/target combination with the highest likelihood of success according to the Shadow Probe. The “entry logic” region is where you’ll want to start, just replace the example logic there to start experimenting. You'll find comments throughout the code to guide you.
If you’re looking for an indicator version you can check out our AI Trading Indicator. The indicator version has properties that are accessible via strategy builder or manually coded strategies.
This NinjaScript download is not assembled which means you have full access to view and change the source code either in NinjaScript Editor or your preferred way to edit .cs files.
Free vs. Premium Version
This version of the free automated trading NinjaScript is missing a few advanced features that make the premium Algorithmic Trading NinjaScript more powerful and robust, but once you understand how it operates you can easily add these features yourself with some coding. The main example of what's missing in the free automated trading version is that it only places simulated trades consecutively/serially (i.e. a new 5/6 stop/target combination probe trade will only be entered after the last 5/6 stop/target trade has been exited. This means that on a wide stop/target combination like 25/25 you might only get a data point every 10 minutes or more for that combination. The Premium version can track multiple probe positions for a single stop/target combo simultaneously. You define a time offset variable that will determine the number of seconds between simultaneous probe entries. This means you can sample a new trade every second for a 25/25 stop/target combination if you want – this higher sample rate gives you a more realistic view of the current market conditions. The premium version also comes with built in tools to track only the most recent (last x) probe trades instead of keeping a running total for the whole day. You’ll also find tools to clear the probe tracking history on certain events (e.g. every 30 minutes, when MACD hits a certain value, when SMAs crossover), and more. The tools are fully explained in comments in the code.
Details / Instructions:
This strategy must be ran on a 1 tick data series. If you need to access a different time series in the same strategy you can copy and paste this Free Secondary Series NinjaScript to add a secondary time series.
When you enable this strategy with the NinjaScript Output window open, you will immediately see a printout of every stop/target combination that will be tested along with its corresponding index number. This index number refers to the index of the array within the code that stores your Shadow Probe trades. This information will be handy as you dig deeper and augment the code. You will see comments in the .cs file that will guide you in using this information. As the strategy runs, the output window will update with every real-time entry, showing its stop, target, and index. By default, these entries are based on the best-performing Shadow Probe stop/target combination for the day, but you can add to or change the entry criteria in many ways and change the Print() commands to reflect what you want to see. At the end of the day the output window will show you the stop/target combination that had the highest daily net profit, both for longs and shorts.
Example output window
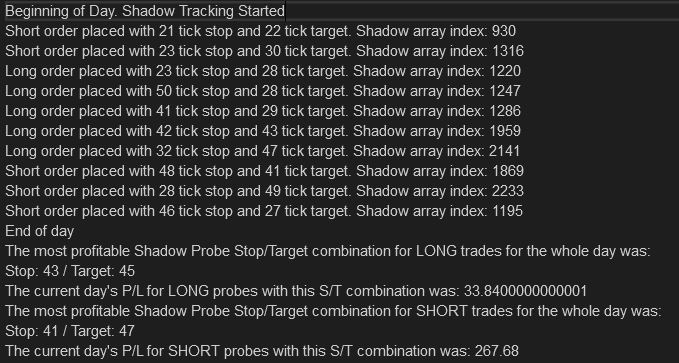
Observing the Print() statements in the NinjaScript code will help you understand how to access the different data available in the Shadow Probe array.
Ideas to augment the Shadow Probe
There are infinite ways to implement the data returned by our free automated trading NinjaScript. Try lowering the stopTargetMax variable so it’s not tracking stop/target all the way to 50.
You could also change this dynamically based on the current volatility or magnitude of recent swings. Leave the stopTargetMax at 50. In the Analyzing Shadow Data region there’s a for loop that finds the max net profit. By default, that loop runs through the whole array to find the max net profit, but you could rewrite that so that it only looks at stop/target combos in the array that are <= the size of recent swings.
Try tracking volatility and only run the shadow tracker when volatility is < x. See example volatility tracking code:
#region Volatility
  // Collecting high/low from last x bars
  volMaxList.Clear();
  volMinList.Clear();
  for(int i = 0; i < volPeriod; i++)
  {
    volMaxList.Add(High[i]);
  }
  for(int i = 0; i < volPeriod; i++)
  {
    volMinList.Add(Low[i]);
  }
  // Finding max and min
  volRangeMax = volMaxList.Max();
  volRangeMin = volMinList.Min();
  volatility = ((volRangeMax-volRangeMin) *4);
  // Set volatility levels
  if (Position.MarketPosition == MarketPosition.Flat)
  {
    volatilityLevel = "low";
    if (volatility > 6)
    {
      volatilityLevel = "medium";
    }
    if(volatility > 10)
    {
      volatilityLevel = "high";
    }
  }
#endregion
Entering per max recent net profit is just a basic example. You can analyze the array in many other ways other than looking at net profit. You could try entering based on:
A stop/target that has a 100% win rate over the last n trades (some might say this is the gambler’s fallacy, but you could say that a stop/target with a 100% win rate over the last x trades is more dialed into the current conditions).
Use the break even values of each stop/target and enter with the stop/target that has the greatest win % over the break even %
Max average profit.
And all of these things (I believe) should only be tracked over a finite moving window (like what profitHistLength does).
One thing you might consider is tracking the time between shadow trades. A high stop/target like 50/50 might go an hour before it’s hit depending on your market, which makes it irrelevant when the time frame you’re interested in is in minutes/seconds.
You can think of the Shadow Probe as a framework, engine or platform you can tailor and plug your own modules into. The more you dig in and customize the code, the more it will become your own proprietary "black box" strategy.
Notes
This NinjaScript add-on is a single zip file that you import directly into NinjaTrader. It’s not assembled which means you have full access to view and change the source code either in NinjaScript Editor or your preferred way to edit .cs files.
This code will not work with releases prior to NinjaTrader 8.
Got something to discuss?
I came across your page, and I’m trying to understand how this shadow logic strategy works. In reading, it appears that I have to initiate the ninjascript editor while the strategy is active within a chart? Does the chart have to be a 1 tick chart? That seems difficult to trade? Is that why you recommend using the code to add another time series? How long does it need to run before it will initiate a trade? It looks like within the code, the shodow probe runs by default for 15 minutes and then initiates live trading? Have you ever done a video to show how to utilize or set this up? Sorry for all the questions, but just trying to understand this very interesting concept. thank you for sharing; looks brilliant.
Hi Gerry. If you load the zip file into NinjaTrader using tools>import in the control center the strategy will be available in the ninjascript editor. From there if click the compile button the strategy will be available in any strategy list (from your chart or control center strategies tab). I believe out of the box it’s set up to track for 45 minutes before trading. See the startTrackingTime and startTradingTime variables. It does need to run on a 1 tick series. You only need to add a second series in the code if you need to do something programmatically on a different time frame. I would recommend running the strategy from the strategies tab on your control center, that way it will be independent of your chart if you need it for visual purposes.
Is this page still active?

it is possible to analyze the strategy in backtesting?
i have tried but no results appear
thanks in advance
Hi Alberto, It was coded to be backtestable with market replay. It will not work with the strategy analyzer. Strategy analyzer gives very inaccurate results, so I’d definitely switch your backtesting method to market replay. It will be slower, but SA is highly inaccurate.
Hello again.
the strategy is excellent. It is possible to obtain more information about the basis of the entries
thanks
Hi Alberto, if you take a look at the “entry logic” region of the code you’ll see two different entry systems (one is only available in the premium version) and a little commented explanation. The one that comes with the lite version enters with the stop/target combination that has the highest shadow profit for the current day (e.g. if the a stop value of 12 and target value of 4 in the long direction has outperformed all of the other possible S/T combinations long or short that the shadow probe has tested, then it will enter a real order that’s 12/4 and long. It will continue to do this until a new S/T combination takes the profit lead for the day. It’s reset at the end of each trading day. The other enters with the stop/target combination that has the highest shadow profit over the last x number of shadow trades. This shorter lookback period is a more adaptive view of the market since market behavior is hardly ever consistent throughout the whole day.
Forgot to mention that the entry logic is meant to be changed or have your own flavor added. We used very simple entry logic as the default, but there are many directions you could go instead. By doing simple math on the data that’s stored in the shadow probe arrays you could for example:
enter on highest win % over last x trades
enter when there have been no losses over the last x trades
enter on highest average profit
Or you can simply add to the existing logic a built in indicator like a moving average or MACD to further filter your entries.