Footprint Chart Indicator
$10.00
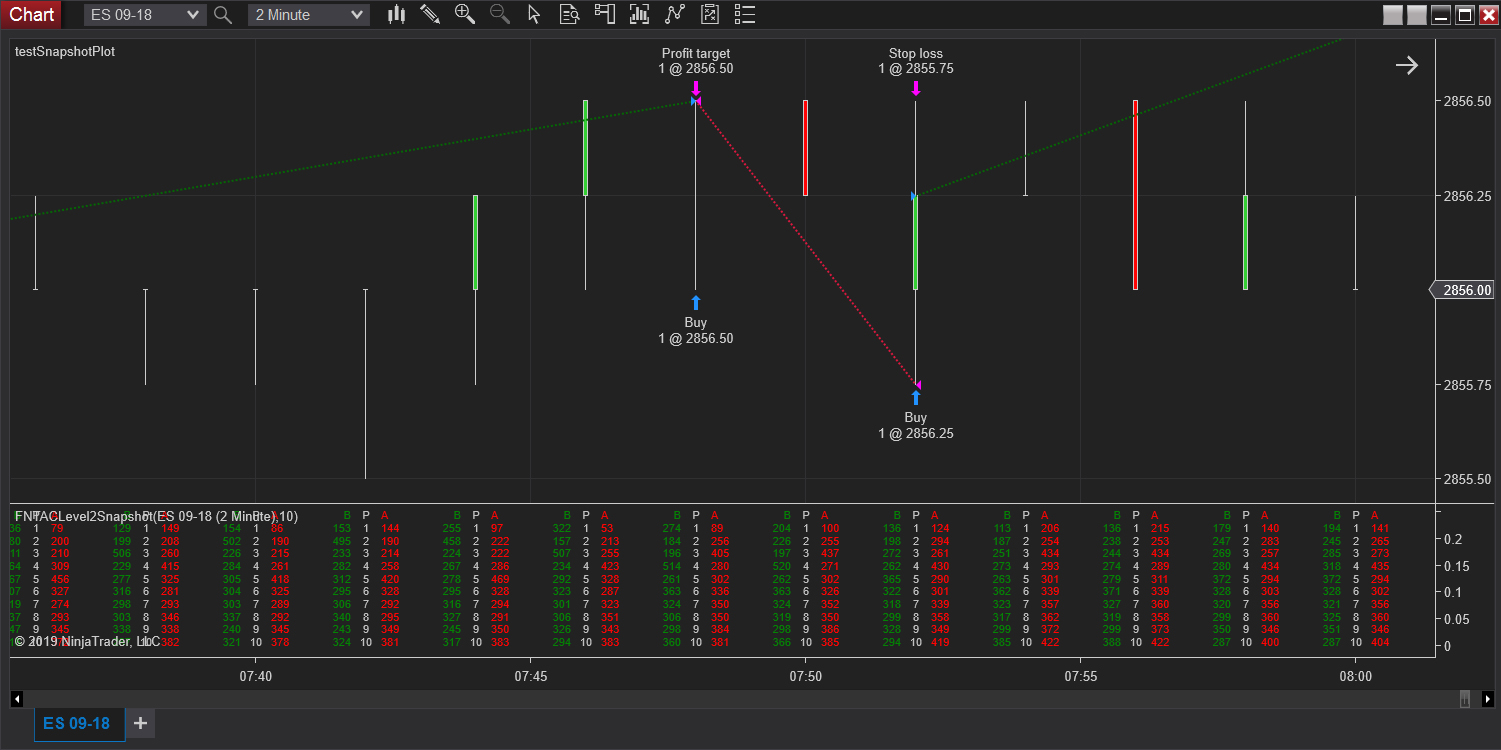
This Footprint Chart Indicator displays all 10 levels of the level 2 order book beneath each bar on your chart. The footprint beneath the current bar updates in real time with every change in level 2 data. The footprints beneath bars to the left of the current bar display a snapshot of the order book at the end of that bar.
Overview

The Footprint Chart Indicator displays all 10 levels of the level 2 order book beneath each bar on your chart. The footprint beneath the current bar updates in real time with every change in level 2 data. The footprints beneath bars to the left of the current bar display a snapshot of the order book at the end of that bar.
The order book is displayed in three columns – bid volume in green, book position (or level) in white, and ask volume in red. The text size scales to fill the indicator panel if it’s resized, so you can make it as small or large as you need. To add another visual dimension of the level two book to your charts, you can use our Order Book Imbalance Indicator alongside the Footprint Chart Indicator in different chart panels. This will allow you to see the order quantity at every level as well as the imbalance between the bid and ask sides all at a glance.
In addition to the visual element of this indicator, the Footprint Chart Indicator also has properties that are accessible via the strategy builder and manually coded strategies. For example, if you wanted to create a strategy that places a long entry order when the sum of the bid volumes at the first five levels of depth is 2x greater than the sum of the ask volumes at those five levels, you could do that using the properties from this indicator. If you call this indicator from a strategy, make sure your strategy’s Calculate mode is set to “On Each Tick”.

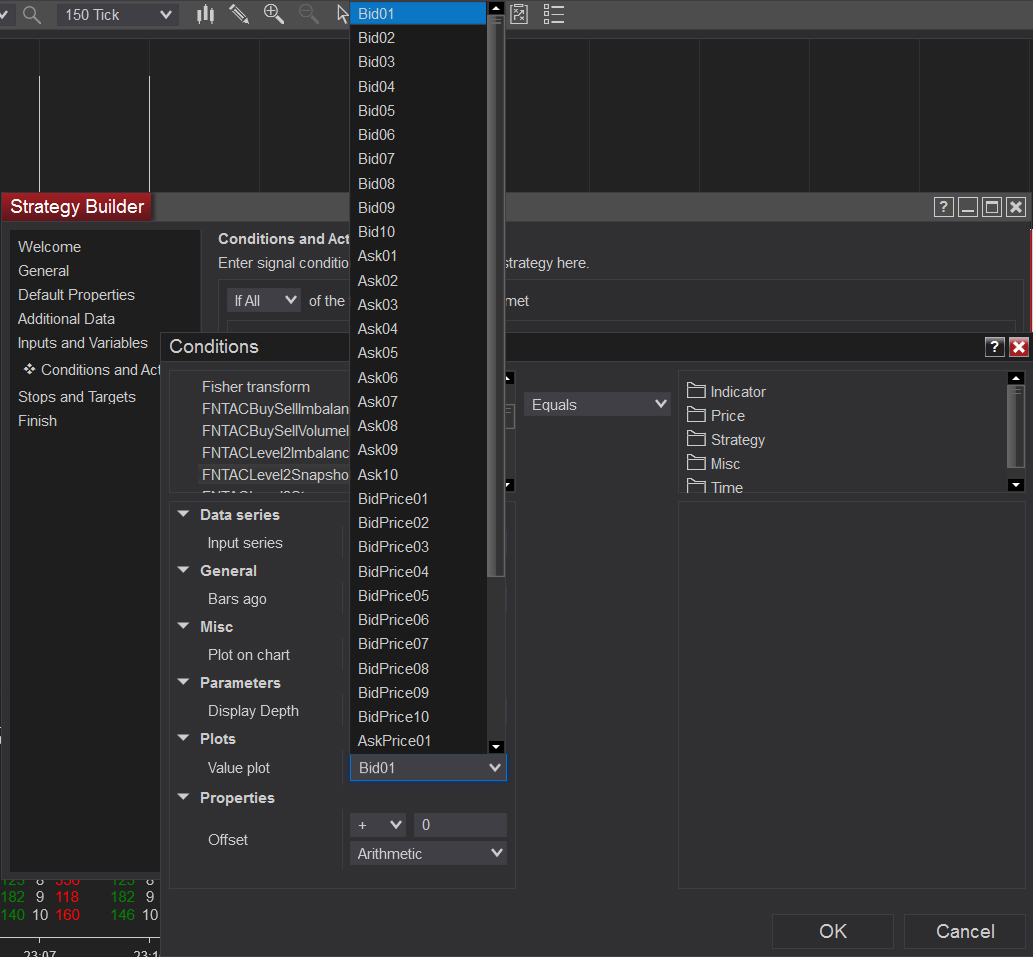
As stated above, the footprint for the current bar updates in real time, and previous footprints will display a snapshot of the order book at the last tick of that bar. This is true for accessing these bars in a strategy as well. Selecting the Bid07 “value plot” and setting “bars ago” to 0 in strategy builder would return the current bid volume at the 7th level of the order book at the instant it is accessed. This would be written as Bid07[0] if you’re manually coding. Selecting the Bid07 “value plot” and setting “bars ago” to 2 in strategy builder would return what the bid volume was at the 7th level of the order book at the last tick of the bar 2 bars before the current bar. This would be written as Bid07[2] if you’re manually coding.
Notes
The price for each level is accessible to you as well. You can find this in the “value plot” menu in the strategy builder (e.g. BidPrice01). If you are coding manually you can use BidPrice05[8] to access the price at the 5th bid level, 8 bars ago.
Level two data can only be calculated in real time (this does not mean the same thing as “live”, this could be sim or replay data as well), so any bars loaded as historical when you create a new chart will not show the book below them. As soon as the indicator is running it will begin to print to your chart after the first bar is complete. It will work with live, sim, and replay data (all of which are processed as real-time). It also only stores data while the indicator is running – if you add or remove any other indicator while this one is loaded, NinjaTrader will actually reload all indicators behind the scenes which will clear any existing level 2 snapshots on your chart. It will then begin to build new snapshots for every new bar after that.
This add-on indicator will not work with releases prior to NinjaTrader 8.


Hello, do you plans to support OrderFlow BidAsk footprint charts, similar to NinjaTrader8 Volumetric BidAsk style charts?
ill be very interested in BidAsk footprint bars with ninjascript access to the individual bidask and volume levels inside a bar, for my trading strategy , thank you!